All “Basics of Machine Learning” classes look similar. We got a clear goal, perfect datasets, and a set of metrics to test our models. Then the working reality comes and it’s nothing like the artificial environment we were living in. The data is messy, the goal unclear and we need to come up with a solution that will make everybody happy (or at least not raging with pitchforks at our doors).
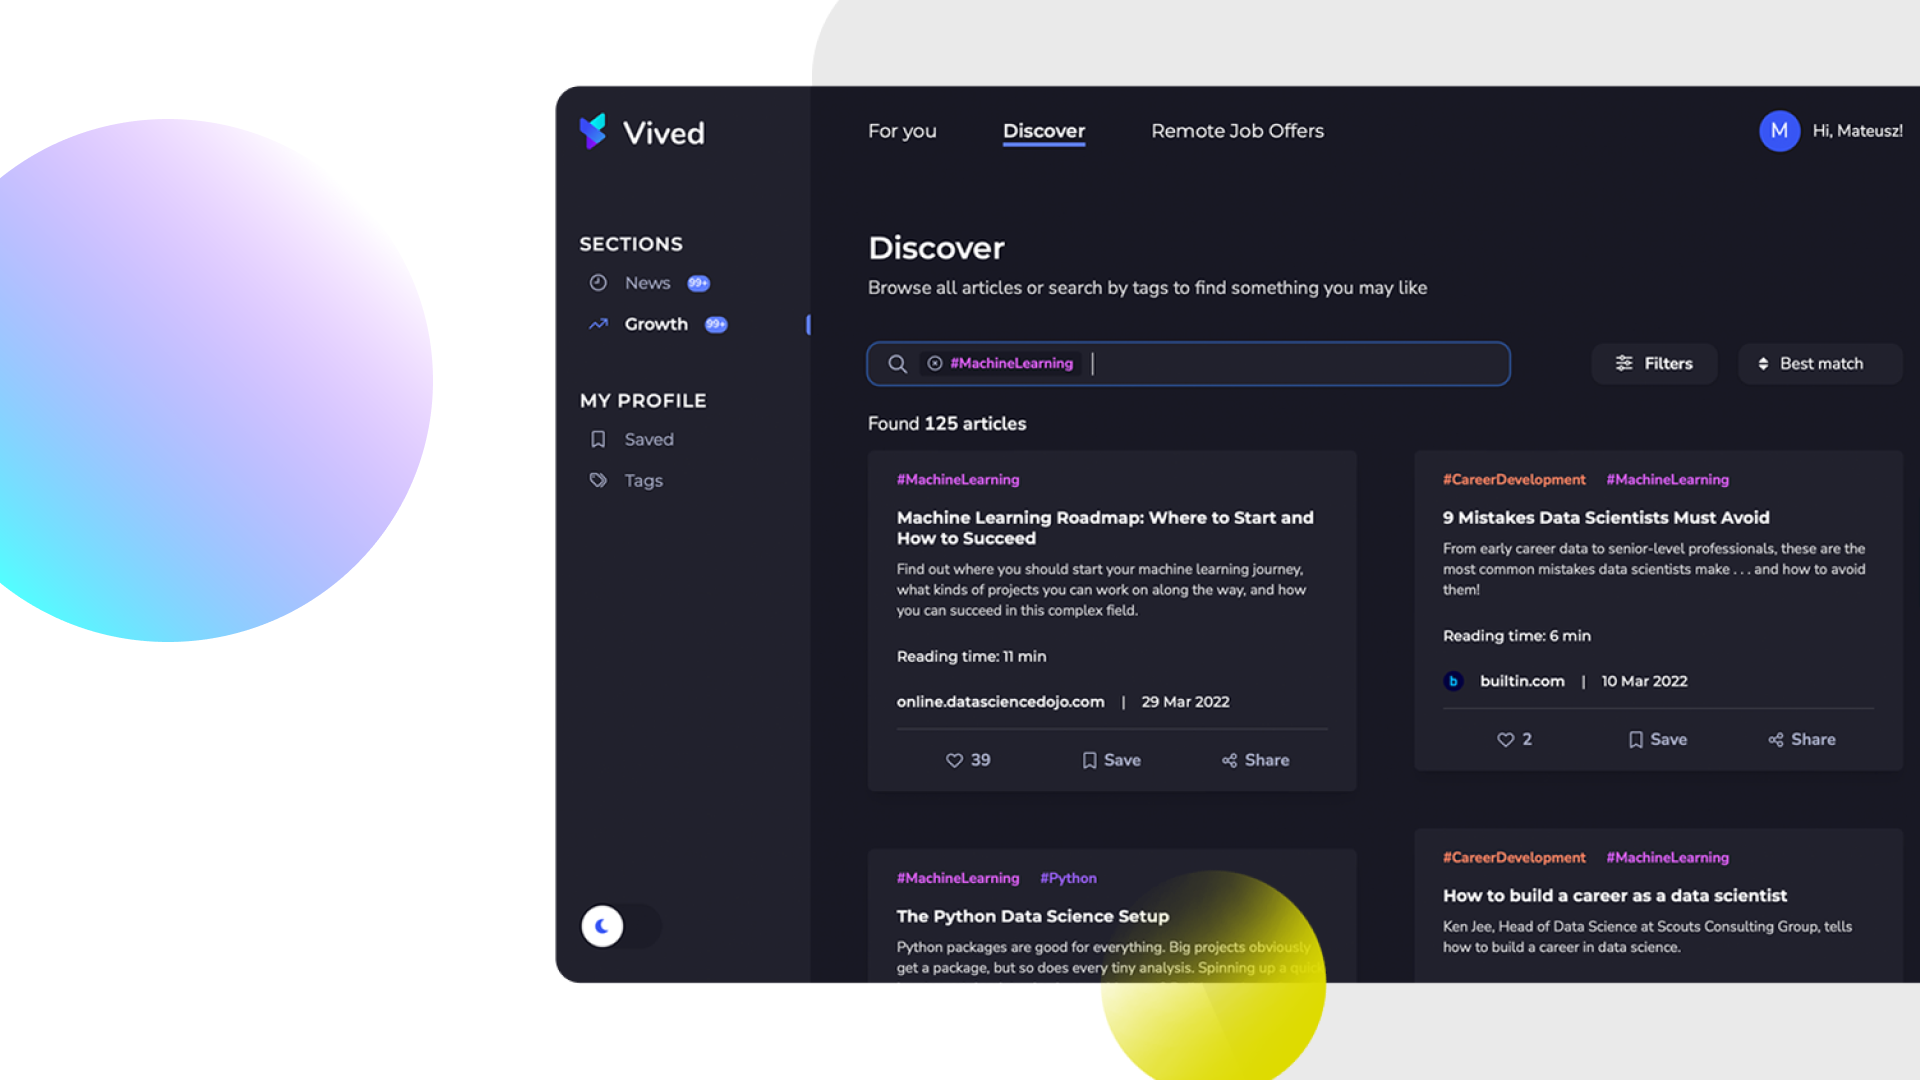
In this post, I would like to show you how we created the articles ranking algorithm in the Discover section. In other sections of Vived we provide curated content based on your specialization. But if you want to broaden your horizon, you can check all articles in our database in the Discover Section. Are you a web developer? There is nothing that holds you back from learning Cloud or Web3, or really anything else.
The First Metric
When we started with the idea of Discover section, only one thing was clear, the output:
Discover will provide all articles filtered by categories and sorted by best match.
What does it mean by “Best match”? That was the unclear part, so we needed to roll up our sleeves and find out.
First things first, we need to define what is the goal of this feature and how we want to measure how close we are to succeeding.
Wait a second shouldn’t the product manager define that?
In a perfect world, yes. But oftentimes product and data science teams are working in completely different worlds. For example, their main goal could be to optimize for 4-week user retention (how many users stay with us for 4 weeks or more). This is a great metric to evaluate how the app performs in the long run, but mostly useless during development. We cannot implement a feature, and wait 4 weeks to have the first indication if the model works or not.
So we jointly discuss with the product team, what outcome they desire and then research what metrics would be the best.
The first goal we decided on was to rank articles based on the chance for positive interactions with users. (What is a positive interaction you might ask? Mostly reads and likes, there are also some fun cases to consider that I will write about another time). Based on the goal, we defined our first metric based on the Mean Average Precision (binary relevance).
Let’s start with Average Precision. It tells you how a single sorted prediction compares with the ground truth and can be described in a formula:

We can see how it works on a basic example, with 5 articles where some of them had positive interaction in the dataset and some had negative or neutral.
| Article 1 | Article 2 | Article 3 | Article 4 | Article 5 | |
|---|---|---|---|---|---|
| pos(k) | 1 | 1 | 0 | 0 | 1 |
| P(k) | 1/1 | 2/2 | 2/3 | 2/4 | 3/5 |
| pos(k)*P(k) | 1/1 | 2/2 | 0/3 | 0/4 | 3/5 |
When we calculate it:

As we can see, the first matches were quite important, but subsequent ones are becoming less and less relevant. We decided to use this metric since it mirrors our user’s behavior. If the first results in ranking do not fit, the chance that the user looks further for them is becoming slim.
In a Mean Average Precision, we take the mean of the Average Precision in all examples.

This metric was great. We already had article interaction data from other sections. There is just one issue: we do not know how our model should react to articles outside the user specialization. Growth & news section contains only articles with tags from within the profile (tag is the name for each category of articles selected in a user profile)
So we don’t have the exact data that we need, just a subset from it. This is a common occurrence in the ML world. Often we can find some datasets to train the models but mostly the dataset is a little bit (or majorly) off. Sometimes they can be still useful, like for example named entity extraction trained on Wikipedia and tested on news articles. We expect the model to perform worse, but still well enough for normal usage. Can the same model work on teenagers’ chat logs? Most likely not.
As we couldn’t get interactions between users and articles from outside their specialization easily. We needed another metric to address the second issue.
Discover more IT content selected for you
In Vived, you will find articles handpicked by devs.
Download the app and read the good stuff!


The Second Metric
We have discussed what should be the desired system behavior in the above mentioned case. In the end, we decided that we would want to give the user articles from within their specialization first.
Let’s imagine how it could look like for an ML Engineer (profile: Python, Machine Learning, etc.). While searching tag “Java”, they should get the article “Java” and “Machine Learning” before “Java” and “JavaScript”.
How to represent this expectation was another matter. We made multiple versions of this metric. All of them were having different issues like thresholds being too arbitrary or unstable results. After much deliberation we came up with the final version of profile match metric:
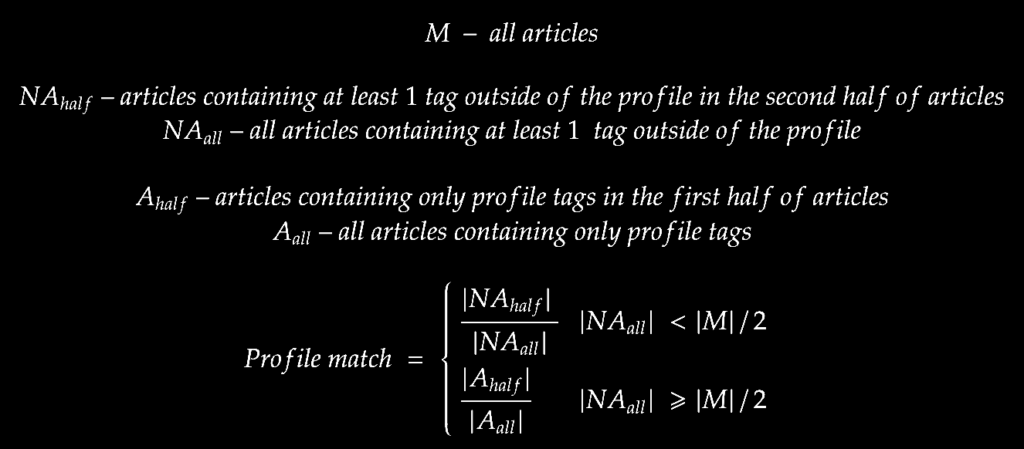
This metric gave us a general sense of how the model would behave on the tags outside the profile. The more articles outside of the user profile appear in the first half of the list, the worse the result.
Measuring
After creating metrics the rest of the way was easy (or at least more standard). We created a training and test set on previous data based on which model was created.
The final model results are:
Mean of average precisions (0-1) = 0.55
near 0 – articles that have neutral or negative interaction with users are selected as first,
near 1 – articles that have positive interaction with users are selected as first
Profile match [0 – 1] = 0.63
0 – all tags from users profile are in second half
1 – all tags from users profile are in first half
Are those results good? There is no right answer here. In Discover users can browse a lot of articles and some mismatches don’t hurt as bad. Therefore we decided that the model performs well enough to implement it in production. This is not the end for our metrics as they will still be useful while experimenting with different models or features.
Discover more IT content selected for you
In Vived, you will find articles handpicked by devs.
Download the app and read the good stuff!
The future
For sure, we need to remember that metrics should be a reflection of business needs. As the application grows our needs change and the metric should follow. Maybe next time the product team would request that tags outside of the user’s profile should be higher in the ranking, to expand their horizon. Who knows?
Hopefully, this article gave you a little bit of an insight into how Data Science works, especially in smaller teams.
Discover more great content!
- Save time and effort
- Read handpicked articles
- Free yourself from spam